Imagine yourself in a Harry Potter movie, reading a newspaper with pictures that move and characters that smile and wave to you! How cool would that be? Now imagine yourself reading an article written by a Hogwarts professor about the economy in the old world. This time, you don’t have people waving at you. Instead, you have an old blackboard with shifting chalk drawings and fluctuating charts that serve as visual aids to what the professor is explaining.
The examples may sound magical, even fantastical. However, that is exactly what we see in online articles nowadays (at least the good ones). We see the use of embedded videos, GIFs, and much more – we live in exciting times!
How is all this relevant to the financial industry? Let’s take a step back and compare reports from the mid‑1990s to reports published today. You will not notice many differences in the look and style of the reports. Of course, in the ’90s, reports were printed, while they are now digital. However, as in the past, most of today’s reports are also plain and static PDF documents. You cannot move the charts to see them from a different perspective or interact with them for better understanding, unless you request the publisher for the data.
On one hand, the financial sector is a pioneer in the use of cutting-edge technology, using high‑performance computing to make split‑second decisions on multi‑million dollar trades, artificial intelligence, digital currencies etc. However, on the other hand, and being the conservative sector that it is, certain things have not changed at all, one of the most noticeable being research reports.
Some research houses have tried to transform this scenario by developing websites that allow users to view, create and adjust charts, but interactive reports offer on-the-spot convenience of data analysis, which gives more power to the end user and saves time by eliminating the need to request data or log into websites. These reports also offer a wide variety of options that are currently not available to customers. They allow immediate interaction while reading a report, as you can select different periods of time, zoom in on a specific section for details or zoom out to see longer trends. Customers can also customize their views, filter out data to focus on specific information or even download the data they like.
Our experience speaks by itself. Not so long ago, probably five years back, clients in the financial sector usually ‘lacked excitement’ when we mentioned Python as one of the main skills in our portfolio. Fast forward two years, and they were approaching us to ask if we have Python capabilities. We are increasingly having conversations with banks to convert regular reports to interactive reports.
We believe it is time to make a change in the way we deliver reports. And it is about time that we use the exciting tools the digital world offers when sending research pieces to investors. Here is a dynamic report example we have created using Python – Dynamic Reports Video
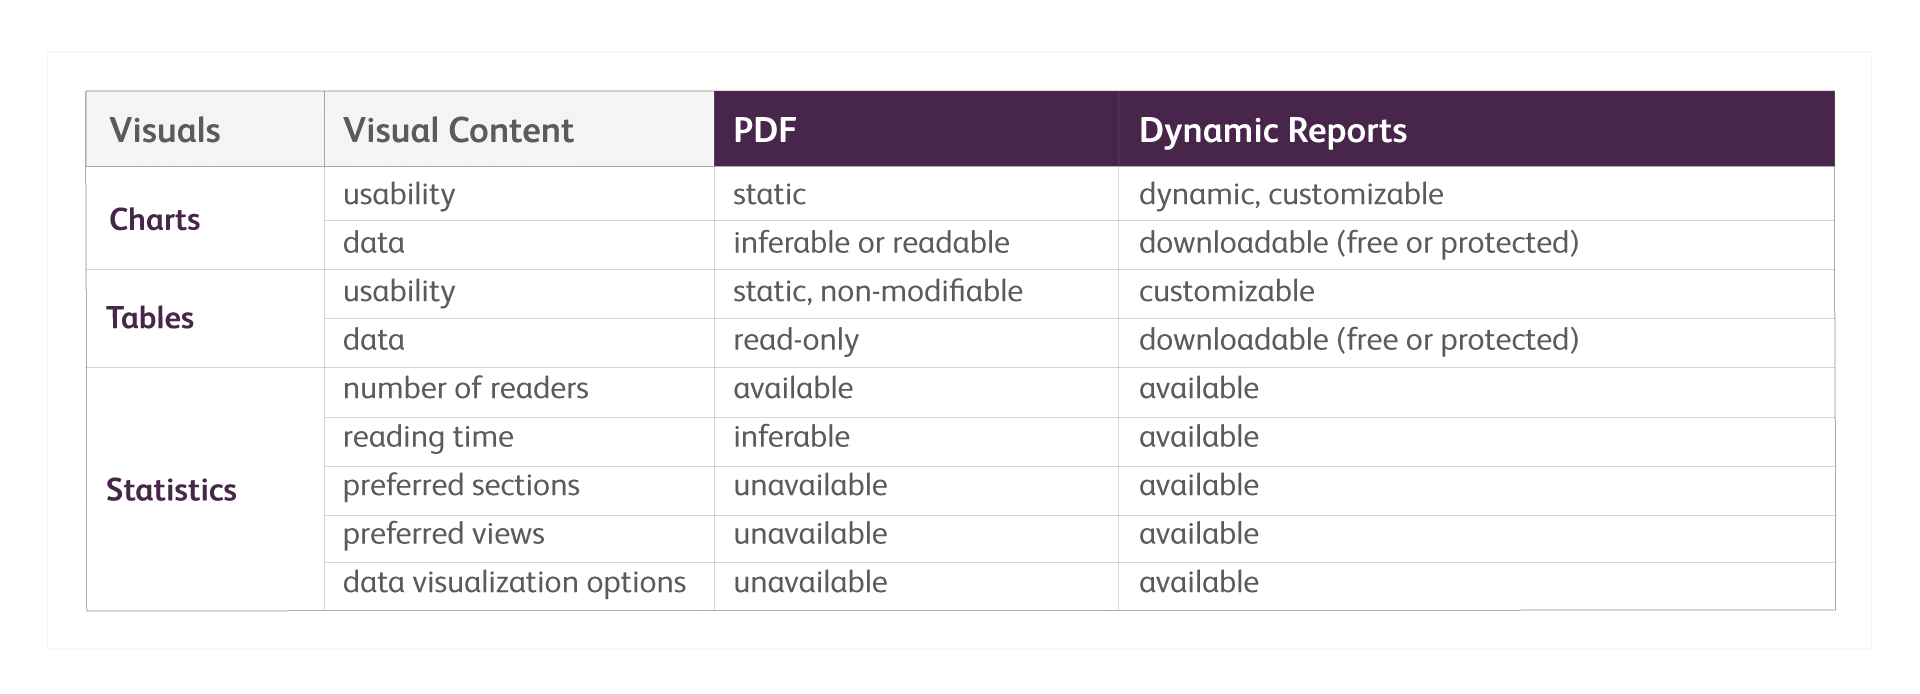
Hosted in the right environment, these reports allow you to set up appropriate levels of security so that a select number of people have access to your research pieces and/or data. You can use them to completely separate your data from your report if that is what you need. Interactive reports also open the door to metrics that are currently nonexistent, such as who opens them, which sections they focus on, which features they use, etc. Thus, they empower you with better statistics so that you can modify what is being written to what is being read, as you can see in the comparison table below.
Comparison Between PDF and Python Dynamic Reports
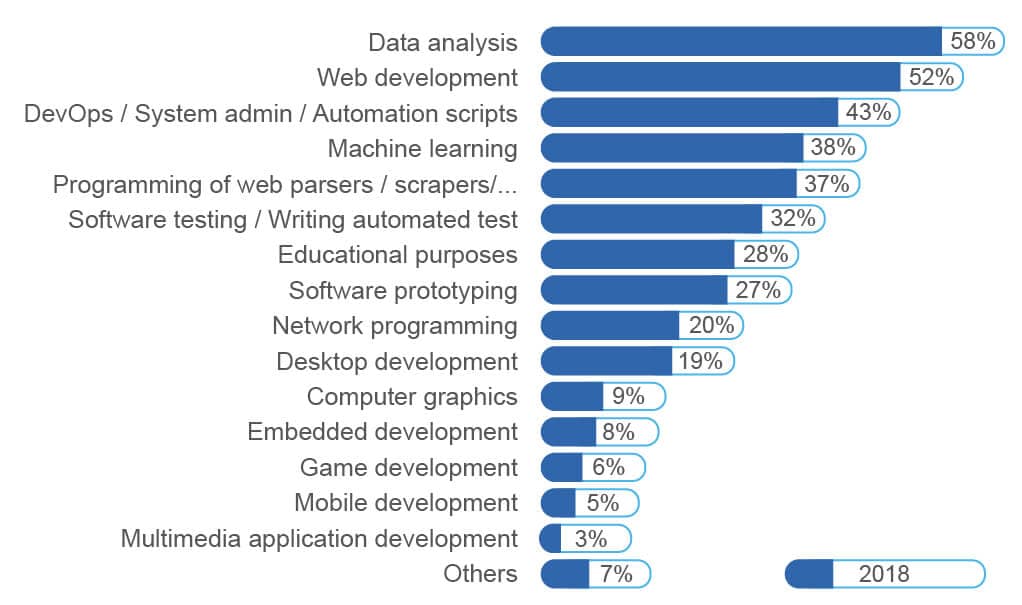
Now take Python as an example of how these trends are evolving in most industries. Python is the fastest‑growing programming language and is mostly used to perform data analysis and for web development including data visualization. This makes it a natural choice for the creation of dynamic and interactive reports, and we foresee this being extensively leveraged to create interactive reports that can also look like classic PDFs.
Python Usage Statistics
Sources: Python Developers Survey 2018 Results, The Incredible Growth of Python
This evidence, backed by our expertise and experience, makes us believe that interactive reports will be the new trend in the financial sector in the coming years. We, as a company, are ready to take on the challenges coming from this change. We have the technology, the expertise, and the people; it is now time for banks and research houses to prepare for what is coming their way.


