When I first arrived in Japan, I was amazed by the train and subway network there. One evening soon after our arrival, my wife and I had dinner with my bosses and then caught the regular commuter train which we assumed would take us home. Imagine our surprise when the train did not stop at any of the interim stations, and then hurtled past our home station as well. It dawned on us that we were on an express train and the next stop would be 35 kilometers (22 miles) away from home. A quick calculation led to the realization that we would only narrowly be able to catch the last train home from the next stop. We made it home past midnight that day with a lesson on Japanese trains and the promise to study my commute before getting on a train.
Similarly, taking the time in advance to assess the patent landscape for a particular technology or invention can be critical for a product or business manager. Patent landscapes can provide unique insights to investment priorities, planning and research areas, partnership opportunities, time to market, trending or disruptive technologies and much more.
At the same time, patent landscapes can be quite difficult to use due to the sheer volume of patents, numbers, and charts if business managers are unaware of how the data translates to a business advantage. “Boarding the wrong train” in this analogy could mean lost time and resources and arriving at the wrong destination. By taking the time to learn about patent landscapes in advance, we can accurately take advantage of the insights from patent landscapes and arrive at the correct destination on schedule.
Competitive Intelligence Study vs. Landscape Study
While there are many different types of intelligence projects, they each provide diverse advantages. A competitive intelligence study can provide insight into the actions of a select set of companies and can offer insights in a more comparative manner. It is thus easy to determine which of the competitor companies may be changing their business to adapt to market disruptions, how their growth in certain sectors compares to each other or how their portfolio may be changing in comparison to yours.
On the other hand, a landscape study is much broader in scope. The study may cover patents (and even non patent literature like white papers) relevant to a technology or a sub-technology of interest. This means that the study now covers patents from companies that you may not even be aware of, and the study can be in a sector of technology you may not yet operate in, or are only now planning to enter. Landscapes also can provide an unbiased view of technology leaders, trending and growing technologies and innovators across the value chain of the technology.
Under the Hood of a Landscape Study
A landscape study is the review and analysis of an entire block of patents relevant to a technology or sub-technology. The technology may be as broad as imaging technologies, and as niche as quantum dots. The study may accordingly range from a few hundred, to tens of thousands of patent documents for a single study.
Patents are rather long and complex documents. The legal language of claims, correlations to drawings and numerous embodiments can make it difficult and time-consuming for most people to make an accurate and informed decision based on a single document, let alone hundreds or thousands of them. With such a large number of patents, it is necessary to break them up into a group of data points that can be used to correlate them.
As a result, an effective patent landscape requires a team of experts who can study and meticulously mark each document under a variety of headers which form part of a taxonomy (more on taxonomy in a moment). This allows each patent to translate into several highly valuable data points signifying its presence under a variety of areas.
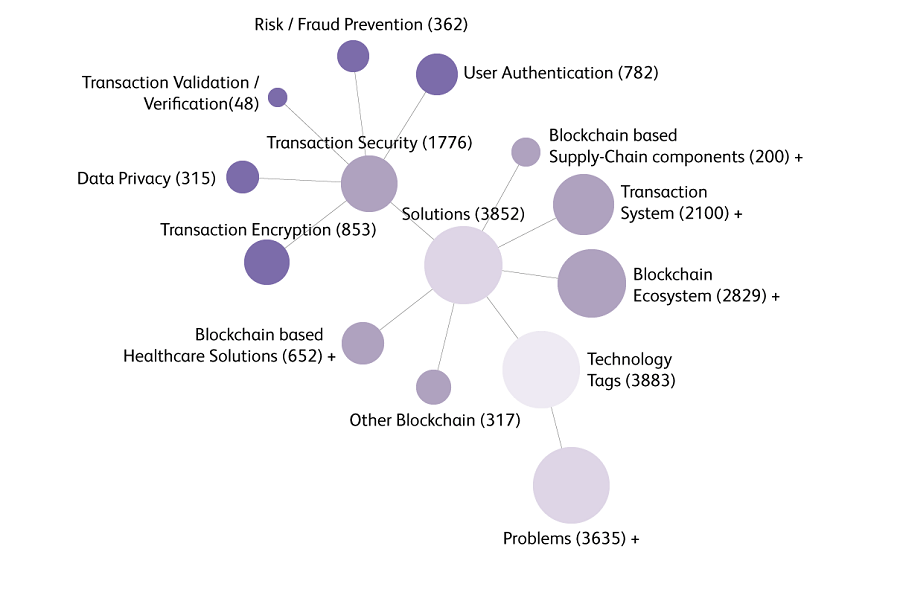
The term taxonomy is used in a standard context and pertains to a scheme of classification. In the domain of Intellectual Property, a taxonomy is usually technology based and starts out broad and with each level adds more detail. Below is an example of a Solution Taxonomy (Figure 1) for Blockchain technologies which may be segregated as being part of the transaction system, Blockchain based Supply-Chain components or Transaction security. Each of these may then be further subdivided into multiple specific solutions. For example, Transaction security branches out to Data Privacy, Risk/Fraud prevention and user authentication, among others.
Figure 1: Solution Taxonomy for Blockchain Technologies
In addition to technology-based taxonomies, application specific taxonomies may also be used to classify patents into different application areas. A problem-solution taxonomy is useful in displaying an additional layer of detail to the study. This approach not only allows business and product managers to see the technology focus for each patent, but also provides insight into the shortcomings of the technology and how the industry is moving to overcome those shortcomings.
For example, a patent may disclose a lag in mobile data transfer rates as a problem and the corresponding suggested solution may be to use the patented antenna design. The use of a problem-solution taxonomy in this case would allow product and business managers to understand that the document focuses on wireless technology, as well as the specific areas of issue (transfer rates, bandwidth, capability) and the approach being used to improve the technology (better design, miniaturization, improved components).
Transforming Taxonomy to Actionable Information
Studying the patent data set and classifying it into the taxonomy is only the first phase of data preparation. At this point, the data is only partially meaningful and merely indicates the population of patents under each of the technology, application, problem or solution headers. While this has some value and can lead to some interesting conclusions, the categorization itself is difficult to digest in any strategic way without certain expertise.
How can we transform data into actionable information? The administrative fields of a patent, like priority dates, application dates, filing company names, patent classification codes, inventor names and citation data become extremely valuable at this point. These fields allow a real-world context for the categorized data which until now would be difficult to correlate to real world events. The categorized data juxtaposed with administrative fields help visualize the data. Innovation and growth timelines, cause and effect of real-world events such as cash infusions through funding, or technology baseline patents that allow further technology growth are now easy to chart. The data is transformed into meaningful information.
With this information, business and product managers now can use the charts to differentiate solution areas by company, making it easy to tell which company prefers to focus on a particular solution area or application. This also makes it possible to tell the lines of business of a technology player by looking at their patent portfolio. Taking again the Blockchain example, a company may focus purely on Healthcare technology applications, or all of its solutions may be pertinent to Transaction security for Financial applications.
Saving Time With Curated Charts
For business and product managers to find the answers to their most pressing business questions, they need curated charts that that provide only the most meaningful information for a patent landscape. This saves time and resources by getting to the most valuable information quickly. (No need to go 22 miles past your destination as I did on my train in Japan!)
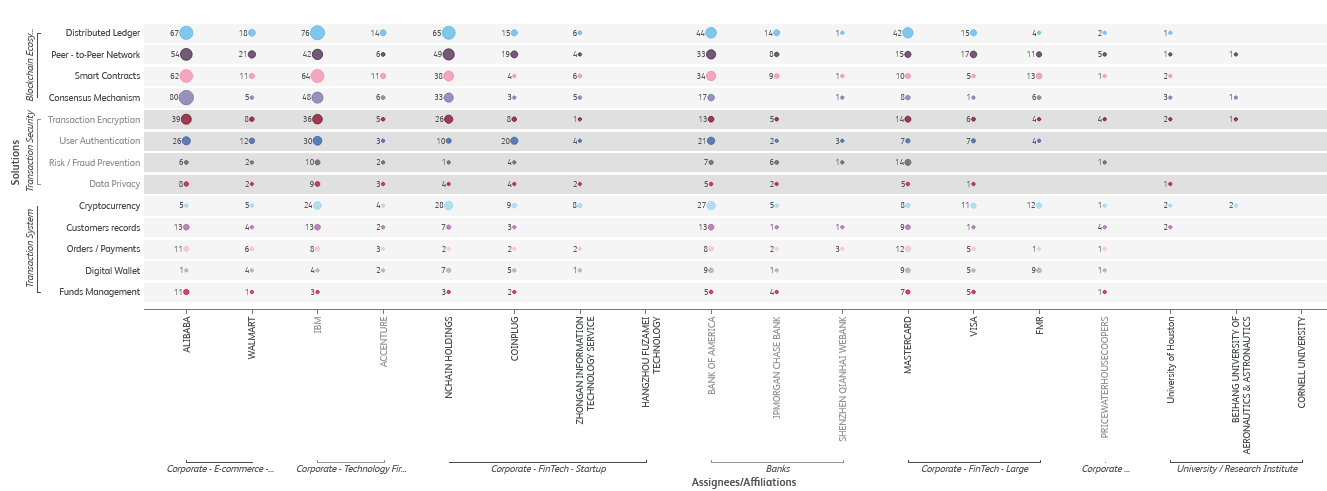
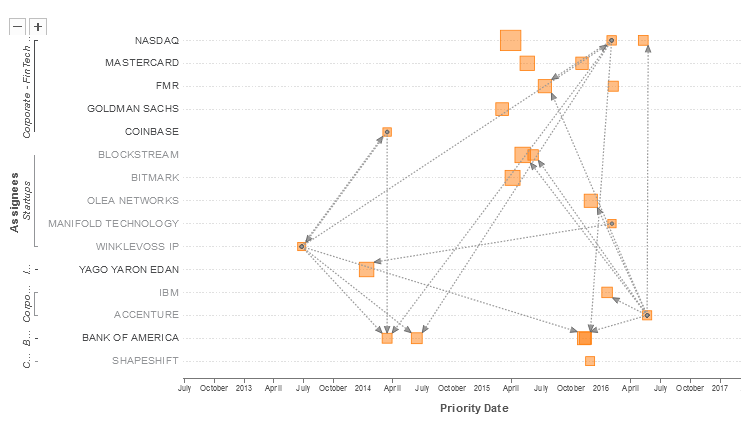
Figure 2 and Figure 3 show some examples of visuals from Evalueserve’s approach. In Figure 2, graphing solutions by assignee can identify which companies are the driving force under which innovation segments. Figure 3 shows how a citation-based chart would allow business and product mangers to see where innovative inventions happened (and by whom) and who is building their portfolios on whose technologies.
Figure 2: Evalueserve’s Approach to Graphing Solutions by Assignee
Figure 3: Citation-Based Chart of Innovative Inventions and Portfolios Being Built
A Big Picture View: Idea Generation, Screening, and Structuring
Idea Generation, Screening and Structuring all can stand to benefit greatly from a patent landscape by allowing business and product managers to see what ideas already exist and how they are being protected and implemented. This provides insight into which ideas the industry already has responded to positively and avoid cul-de-sacs in innovation and product development. The direct result is an improved time to market. It is also possible to combine market and competitor data with patent data to derive insights into the best potential markets for your investment. This is achieved by analyzing competitors by geography, current product features, and popular technologies converging towards a market-wise ranking. Together, this provides a big-picture view not only about the growth of a product, but where it would best fit as well.
In addition, it is possible to factor in specific business needs to answer questions such as ‘how does a patent landscape help optimize R&D costs?’ For such a scenario, a landscape would be focused on a defined R&D product/technology and would cover other innovators in the domain. A detailed taxonomy combined with bibliographic data would help identify the following insights: new problem areas in the technology, solutions that are aimed at solving the problems, which solutions are on the decline, and which ones are on the rise. This data (combined with other insights) when combined with market data from innovators across the globe would enable product and business managers to avoid the stagnating areas and focus on the growing needs of the domain directly proportional to an optimized process.
Conclusion: Arriving on Time and on Budget to the Destination
Once I learned which train lines serviced what areas, understood the alternate routes where my train pass was eligible, and most importantly could identify the difference between the Kanji symbols for local trains (普通) and Express trains (快速), I was able to successfully navigate through Tokyo. Just as understanding which train lines serviced what areas was critical to arriving at my destination, navigating patent landscapes requires the same forethought and strategy. When business and product managers have a clear understanding about the components of the landscape report, as well as the reasons behind using certain data and what the data represents, they are in a better position to make decisions that positively impact their business.
Evalueserve’s team of experts can serve as conductors on the landscape journey, making the ride efficient and productive. We can conduct research to corroborate data and provide actionable insights for you and your team. All you need is a technology and a business objective. We will do the rest. Allow our experts to make suggestions and define the scope of the landscape based on your study.
Contact us to see a sample report, and to find out more about how our team of experts can help you make the transition from data to business decisions.
Related Resources:


