February 17, 2025
A 25 bps rate cut in December 2024 failed to encourage markets, as the US Federal Reserve painted a slightly dovish 2025 rate outlook, while the ongoing QT has added to the gloom with falling ON RRP and bank reserves sucking liquidity out of the banking system.
Key highlights
- The US Federal Reserve slashed interest rates by 25 bps in December and at the same time scaled back on future rate cuts (just two against four planned for 2025), causing the S&P 500 to fall ~2.95% and UST 10Y yield to rise ~12 bps on the same day. The 30Y Fixed-Rate (FI) mortgage-10Y UST spreads (which indicate credit risk), which have widened since the start of the Quantitative Tightening (QT) in June 2022, remained at elevated levels despite the rate cut announcement.
- The 30Y FI mortgage has been rising since the start of QT, and it shot past 7% in January 2025 from a record low of 2.75% four years prior. The long-term mortgage rates have increased at a faster pace than average interest on outstanding mortgages, which are currently at around 4%. More than half of existing mortgage holders have an interest rate below 3.75% on their home. In absence of favorable interest rates, existing homeowners are either putting their properties on hold or not selling them at all, which has led to a shortage of available-to-buy homes and pushed up their prices at the same time.
- Since June 2024, the Fed has capped the monthly Treasury securities drawdowns to $25 billion while maintaining the existing pace of mortgage-backed securities (MBS) withdrawals at $35 billion per month. Consequently, MBS now account for about 60% of total monthly runoffs, which is a likely reason for the increasing long-term mortgage rates despite three rate cuts in 2024. Even after the QT likely ends in H1 2025, the 30Y FI mortgage rates are expected to remain in the 5.75% to 7.25% range throughout this year, thus bringing no respite to prospective buyers anytime soon.
- The decline in overnight reverse repurchase agreement (ON RRP) levels is much faster than bank reserves, whose levels had increased significantly during the QE, which ultimately resulted in expansion of balance sheets at commercial banks. Tighter Supplementary Leverage Ratios (SLRs) forced the banks to move a major part of their deposits to money market funds, which contributed to high ON RRP levels during that period.
- The ON RRP take up has fallen ~95% to $125 billion (as of January 30) from its December 2022 peak, accounting for most of the liquidity drain in the system, while bank reserves have fallen by more than $1 trillion in the last four years to $3.2 trillion by end-January (or 14% of total bank commercial assets). The ON RRP levels are expected to fall to zero by the end of first quarter this year and any money drain thereafter would come from a drop in reserves, which have already fallen to ~10% of GDP, an adequate threshold for the QT to end at. Going by the current pace, the balance sheet runoffs would end sometime in H1 2025.
1. A Dovish Cut – At Mortgage Spreads Apart
The US Federal Reserve held interest rates steady at the January 29, 2025 meeting1 in line with expectations set during the December 2024 FOMC2 meeting when they were brought down to the 4.25%-4.50% target range. The 25 bps cut, which was supposed to be a victory lap, turned out be a warning shot for markets, with the S&P 5003 falling 2.95% after the announcement and finishing 3.6% below the December 6, 2024 record close, while the UST 10Y yield4 rose nearly 12 bps to close around 4.50%. Markets usually respond positively to any rate cut announcement, but this was a rare phenomenon as the Fed laid out a rather dovish rate outlook for 2025, penciling only two rate cuts this year against the four that had been projected in September of last year. Although the S&P 500 has hit fresh highs again in January because of strong earnings5, the UST 10Y yield continues to stay above its December levels.
Since the rate cut was announced, mortgage rates have also gone up alongside Treasury yields. The 10Y UST and 30Y FI mortgage rates change over time roughly in line with each other; the spread between the two determines the risk of taking on an investment, which essentially considers whether or not an existing mortgage holder or a potential new home buyer would be able to pay back the loan over its period. The spread (or the credit risk) has increased since the Fed started its QT program in June 2022 (see figure 1), which resulted in higher mortgage rates than those found in normal economic conditions.

Description: The spread (or the risk) between the 30Y FI mortgage and 10Y Treasury yield has increased since the beginning of the quantitative tightening (QT) in June 2022, which has resulted in mortgage loans becoming more expensive than what they otherwise would have been in normal conditions. The area shaded in light blue indicates recessionary periods. Source: Fred.stlouisfed.org.
2. The Lock-in Effect
The average 30Y FI mortgage was at an all-time low at 2.75% in January 2021, when interest rates were at a near-zero level, but as the Fed officially kicked off tightening in June 2022, the average mortgage rates started to rise and even shot past the 7% mark earlier in January6 (as shown on the primary Y-axis in figure 2), despite the three rate cuts announced in the later part of the previous year. In simple terms, for a home that costs $420,000, a buyer at current rates would have to spend about $460,000 in total interest payments as opposed to just $157,000 for the same unit in 2021. The record-low mortgage rates during the pandemic led to increased home sales, which pushed up their prices, but it was largely during the March 2022-July 2023 hiking cycle that the financing costs of securing a new home soared dramatically, which in turn created the lock-in effect.
The Fed raised interest rates 11 times during this period7, effectively lifting it to 5.5% by July 2023 from just 0.25% 18 months before. The interest rates on existing mortgages have failed to keep pace with the average interest on new mortgages, with effective interest rates on outstanding mortgages currently at around 4% (as shown on the secondary Y-axis in figure 2), while that of 30Y FI rate mortgage is hovering around 7%. Over half of existing mortgage holders have an interest rate roughly below 3.75% on their home, which explains why they have grown reluctant to sell their homes, resulting in low inventory and a high cost of financing in the market. As a result, a record 26% of buyers paid for a home in cash in 2024, while the remaining 76% relied on mortgage financing8.

Description: Average interest on 30Y FI mortgage has far outpaced effective rates on outstanding mortgages, which in turn has led to a lock-in effect as more than half of borrowers have interest rates below 3.75%, making them hesitant to sell their homes. Source: Fred.stlouisfed.org and Bureau of Economic Analysis (BEA).
3. The QT Pie – MBS Takes the Lion’s Share
The US Federal Reserve began to cut interest rates in September 2024, but even that has failed to tame mortgage rates, which are currently hovering around 7%. The ongoing QT, which has seen about $2.1 trillion of bonds being rolled off the Fed’s asset portfolio since June 2022 (see figure 3), is partly to blame for high mortgage rates. The Fed began with $47.5 billion in monthly drawdowns, accelerating that to $95 billion per month in September 2022 ($60 billion in Treasury bonds + $35 billion in MBS), before capping Treasury securities withdrawals to $25 billion per month starting in June 20249, thus slowing the overall pace of QT to $60 billion per month, while maintaining the existing rate of MBS runoffs.
When the Fed was buying large quantities of securities ($80 billion in Treasury bonds and $40 billion in MBS) during the pandemic, it brought interest rates on mortgages to historic lows—but now the board is allowing large quantities of portfolio on their books to run off, of which about 60% is MBS; this is a likely reason why mortgage rates are rising despite the fall in interest rates. The QT is expected to run until H1 202510 but it might not bring any relief to homebuyers anytime soon, as the 30Y FI mortgage rates are expected to remain in the 5.75%-7.25% range in 2025, as per Logan Mohtahsami, lead analyst at HousingWire11.

Description: The Fed has reduced its balance sheet by ~$2.1 trillion since June 2022, with MBS currently making up ~60% of total monthly drawdowns. They account for $35 billion of the total $60 billion monthly runoffs, a likely reason for elevated mortgage rates despite recent cuts to benchmark intertest rates. The area shaded in light blue indicates tightening cycles. Source: Fred.stlouisfed.org.
4. Liquidity Scare: Falling ON RRP Volumes
The liability side of the Fed’s balance sheet is another indicator of the QT coming to an end in the first half of this year. During and around the QE, the take-up at the ON RRP soared to $2.5 trillion by December 2022 from close to zero in early 2021 (as shown on the primary Y-axis in figure 4). When the Fed implemented the tightening, the ON RRP volumes fell by about 95% from their December 2022 peak to currently around $125 billion (as of January 30), accounting for most of the liquidity drain from the system. ON RRP levels are seen as a gauge for liquidity in markets, which were excessively liquid during the QE when money market funds had more supply than what was already available on the open market.
The Fed balance sheet had nearly doubled to a record ~$9.0 trillion by June 2022 during the easing cycle, which also led to an increase in the supply of reserves to the banking system, which ultimately resulted in an expanded balance sheet for most commercial banks. Regulatory ratios such as the SLR12 usually share an inverse relationship with bank assets, and they tend to become tighter with higher reserves, ultimately leading to higher balance sheet costs. The average SLRs of the six largest lenders (JP Morgan, Bank of America, Citigroup, Morgan Stanley, Goldman Sachs and Wells Fargo) were already in the 7 range (as shown on the secondary Y-axis in figure 4) before regulatory relief13 was put in place, which allowed these banks to exempt Treasury securities and reserves from their SLR calculations during Q2 2020-Q1 2021. These exemptions artificially kept the leverage ratios low, but as soon as they were lifted, the SLRs rose again, forcing banks to move a significant part of their deposits to money market funds as part of their cost control measures and boosting the ON RRP takedowns during that period.
The ON RRP levels have fallen in sync with SLRs since the QT was implemented in June 2022, raising concerns of a liquidity crunch and a spike in overnight financing rates—a similar scenario to September 201914.

Description: ON RRP levels have halved to $1.25 trillion from their December 2022 peak as average SLRs have also fallen, raising concerns that it would drain the liquidity out of the banking system. The area shaded in light blue indicates the regulatory exemption period. Source: Fred.stlouisfed.org and Federal Reserve Board.
5. Endgame: Falling Bank Reserves
It is estimated that by the end of Q1 2025, the ON RRP levels will fall to zero and any money drain thereafter from the banking system is likely to come from a fall in bank reserves. Just like ON RRP, bank reserves also increased during the QE, rising from about $1.6 trillion (or 9% of total bank commercial assets) to ~$4.3 trillion by end-2021 (as shown on the primary Y-axis in figure 5), equivalent to a historical maximum of 19% of total commercial bank assets (as shown on the secondary Y-axis in figure 5). Although bank reserves have since fallen to $3.2 trillion by end-January (or 14% of total bank commercial assets), the decline is not as drastic as observed in ON RRP levels.
Bank reserves have already fallen to ~10% of GDP by end-January (as shown on the secondary Y-axis in figure 5), well within the 10%-11% range15 outlined by the Fed required to put an end to QT. Going by the current pace, the balance sheet run-offs would end sometime in H1 2025 once ON RRP levels are down to zero. Although most of the liquidity drain is coming from low ON RRP levels, should the bank reserves fall further, it could add to those liquidity concerns.
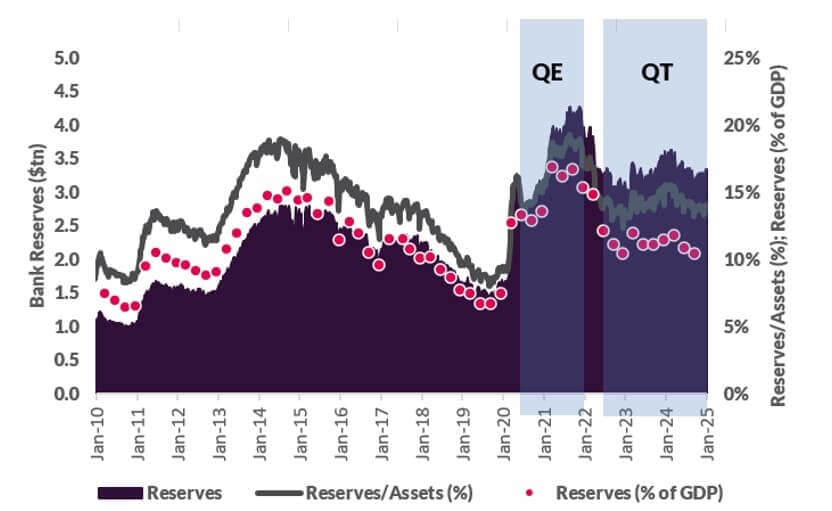
Description: Bank reserves have fallen to ~$3.2 trillion or 10% of GDP from a record high of ~$4.3 trillion in December 2021, which also represented a ~19% (a historic maximum) of total commercial banks’ assets. The area shaded in light blue indicates easing and tightening period. Source: Fred.stlouisfed.org.
Closing Remarks
Although QT is expected to end somewhere towards the end of first half this year, it is not expected to make mortgages cheaper anytime soon, despite some easing in market conditions. The credit risk coming out of housing market is likely to stay in the upper range largely due to high mortgage rates, while tight liquidity would be a concern throughout this year as a result of falling ON RRP and bank reserves.
1 Read the January 2025 FOMC statement (Federal Reserve Board)
2 Read the December 2024 FOMC statement (Federal Reserve Board)
3 S&P 500 live chart (S&P Dow Jones Indices)
4 UST 10Y live chart (S&P Dow Jones Indices)
5 S&P 500 Hits Record High Amid Strong Earnings and Easing Inflation Concerns (The New York Times)
6 US 30-year mortgage rate tops 7%, highest since May 2024 (Reuters)
7 Federal Funds Rate History: 1980 Through the Present (Bankrate)
8 First-Time Home Buyers Shrink to Historic Low of 24% as Buyer Age Hits Record High (National Association of Realtors)
9 Read the Chair Powell’s full transcript (The US Federal Reserve)
10 Fed’s QT Can Continue Despite Repo Market Volatility, RBC Says (Bloomberg Finance LP)
11 2025 Mortgage Rate Forecast: What Another Trump Presidency Means for Rates (CNET)
12 The supplementary leverage ratio is the US implementation of the Basel III Tier 1 leverage ratio, with which banks calculate the amount of common equity capital they must hold relative to their total leverage exposure.
13 Read the full report on Banks’ Balance-Sheet Costs, Monetary Policy, and the ON RRP (NewYorkFed)
14 Read our blog All Eyes on the Fed as the March FOMC Meeting Draws Closer to know more on rise in short-term interest rates during September 2019.
15 Federal Reserve to Continue Running Down Assets Until End-2024 (Fitch Ratings)
Talk to One of Our Experts
Get in touch today to find out about how Evalueserve can help you improve your processes, making you better, faster and more efficient.